This is an old bug which seems to be in the .NET Framework since a long time but since it is highly sporadic it was not found until now. I have got reports that on some machines NGen.exe did use all of the computers memory which did lead in Task Manager to this pattern:
The biggest process on that machine was always Ngen.exe and everything was very slow. This tells me that NGen did not recover from time to time from its high memory consumption but that it did allocate like crazy until the machine had no physical memory anymore. When an application uses all memory the OS will page out all memory to the hard disk when no physical memory is left. After writing many GB of data to the hard disk NGen can continue to allocate more memory until no physical memory is left and the OS will write all memory to the page file again. This will continue until Ngen.exe finally hits the commit limit which is the sum of Physical Memory + Page File Size which results in an Out Of Memory error. Only then the process will terminate.
When NGen did go crazy like this MS support suggested to delete the registry key Computer\HKEY_LOCAL_MACHINE\SOFTWARE\Microsoft\.NETFramework\v2.0.50727\NGenService\Roots and its decendants. That fixed the issue but it remained mysterious why this was happening and what exactly did break. When you delete the registry key NGen will build up its Ngen root dll cache automatically. Inside the registry keys was no obvious garbage data visible and the issue remained mysterious. But finally I have got my hands on a machine where the issue was still present which allowed me to take more evidence data.
What Do We Know?
- ngen install somedll.dll or ngen createpdb somedll.ni.dll causes NGen.exe to consume many GB of memory
- NGen breaks due to corrupted registry keys
- After deleting the registry key below \HKEY_LOCAL_MACHINE\SOFTWARE\Microsoft\.NETFramework\v2.0.50727\NGenService\Roots NGen will build up the registry structure by itself which “fixes” the issue
What data should we get? Part of it is based on experience and the other part is more psychological. If you hand over a bug report to someone else you should anticipate that he/she is not familiar with your favorite debugging tool (e.g. Windbg). Filing a bug report with random findings is easy. Filing a bug report which enables the support personnel to get down to the real root cause is much harder. When I have a nice reproducible bug which I can repeat easily as often as I want I tend to get all data I can get. When file/registry issues are involved I would get some or all of the things below.
Full Scale Data Capturing
- Capture a procmon trace which will show all accessed registry keys and files
- That is easy to do and provides a general understanding which registry keys are accessed
- Dump the affected files/registry keys
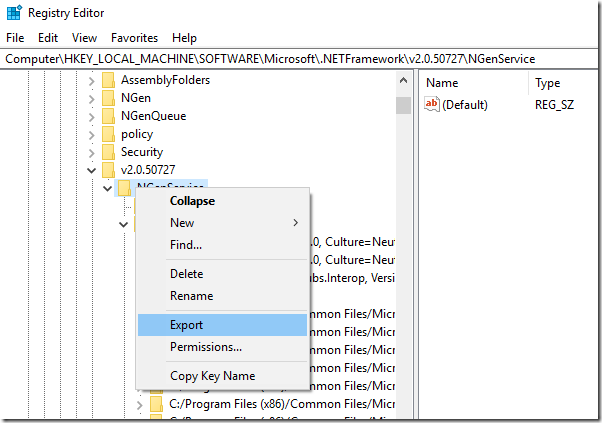
- E.g. export the registry hive \HKEY_LOCAL_MACHINE\SOFTWARE\Microsoft\.NETFramework\v2.0.50727\NGenService from regedit so someone can take a look at the accessed data
- That is much easier than to crawl though a memory dump to reconstruct the accessed registry/file contents
- Capture several memory dumps while the problem builds up
- procdump is a great tool to take several dumps in a row once a specific condition has been reached
- Capture ETW Traces to get the full picture
- It potentially shows the evolution of the problem. But this depends highly on the skill set of the support engineer if that data is useful to them
- Capture a Time Travel Trace
- This gives much detail but it can be time consuming to analyze a multi GB trace. If you or the support engineer do not know exactly where to look you will only produce a multi GB random data file which is not used at all
Getting the right data which somebody else can work with is tricky since you do not know with which tools someone else is most comfortable with. Normally you will start with the easiest data capturing method and based on the analysis of the data you did get you will need to decide what else is missing to get the full picture. That usually will involve capturing more data with a different tool. But if you capture everything from procmon tracing up to a time travel trace the chances are good that you can reduce the time until the investigation leads to somewhere from weeks down to minutes. Lets start with the easy data gathering approach first:
Getting A Procmon Trace
Procmon is a SysInternals Utility which can record all process starts along with all file and registry accesses. When you start it you can add a filter for the process of interest. In our case it is ngen.exe.
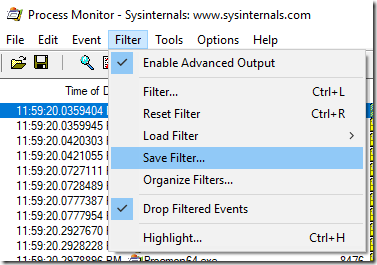
Since Procmon records system all events the resulting memory needed by this tool can become quite large. To prevent that is is most of the time better to discard all not interesting events from memory by checking the checkbox of File – Drop Filtered Events
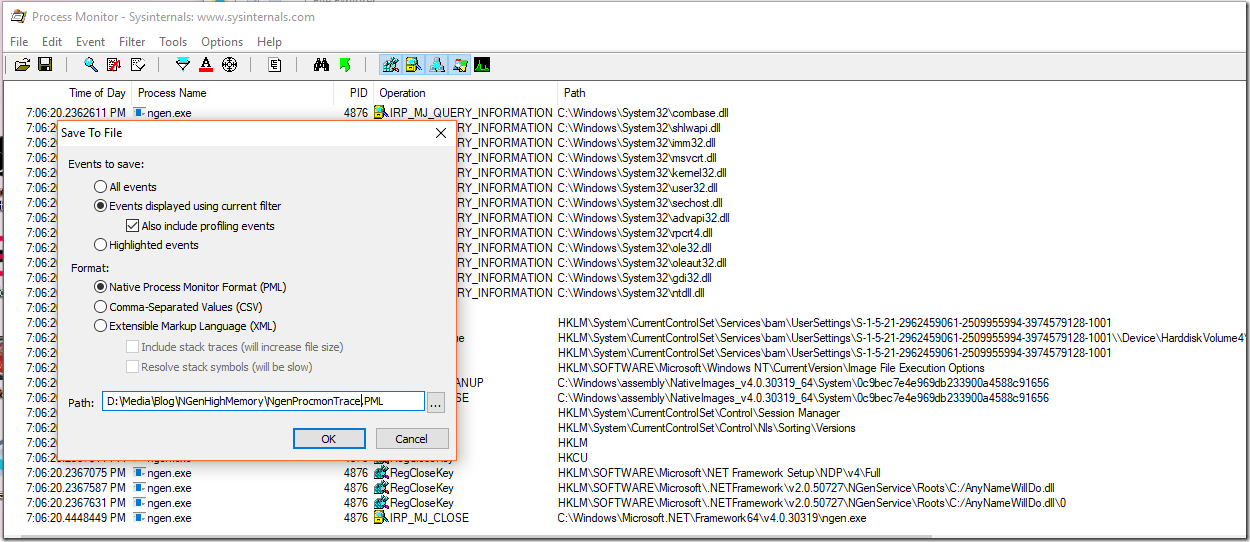
That is important if you need to wait for an incident to run for hours. You should always get the latest version of procmon since from time to time some memory leaks or other things are fixed which could hinder a successful data collection. The gathered data can then be saved as PML file which can be read into the tool again on a different machine. To save the data you can choose a nice file name which describes the problem. Naming is hard but be precise what the trace actually contains. In a few weeks even you do not know what that file was for.
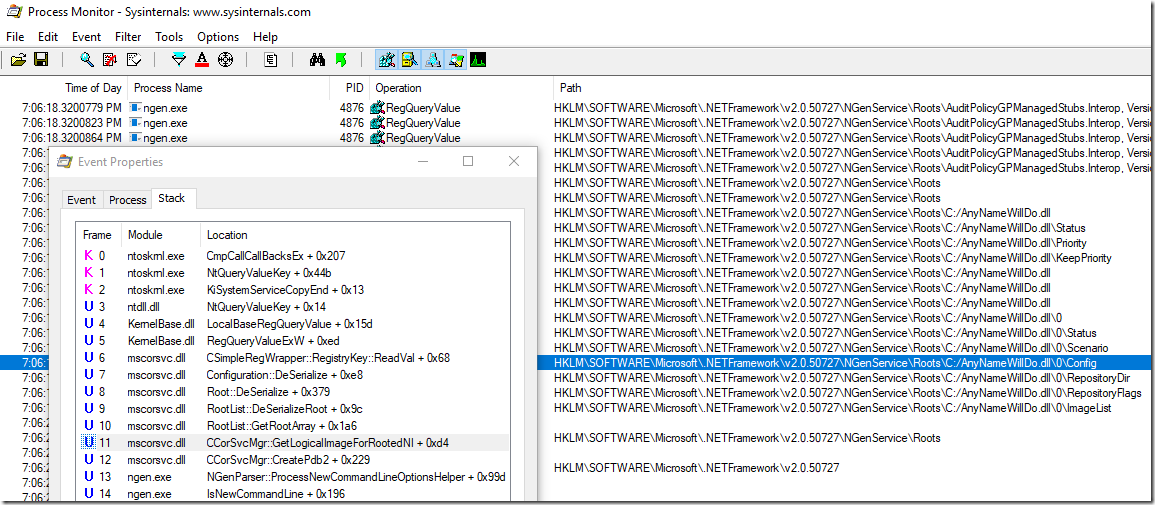
Under the hood Procmon uses ETW to gather the data. What does that mean? For every file/registry access and process start/dll load you will get a full call stack if you click on the event properties which can tell you already as much as a memory dump:
In our NGen case we find that NGen deserialized the native image roots from a registry list. That is a very powerful capability but you need to set the symbol server and the path to dbghelp.dll from a Windbg installation (x64 usually) to get valid call stacks. There is one caveat: Procmon cannot decode stack traces from managed code which makes this otherwise great tool severely limited mainly for unmanaged stack trace analysis.
Dump The Registry Keys
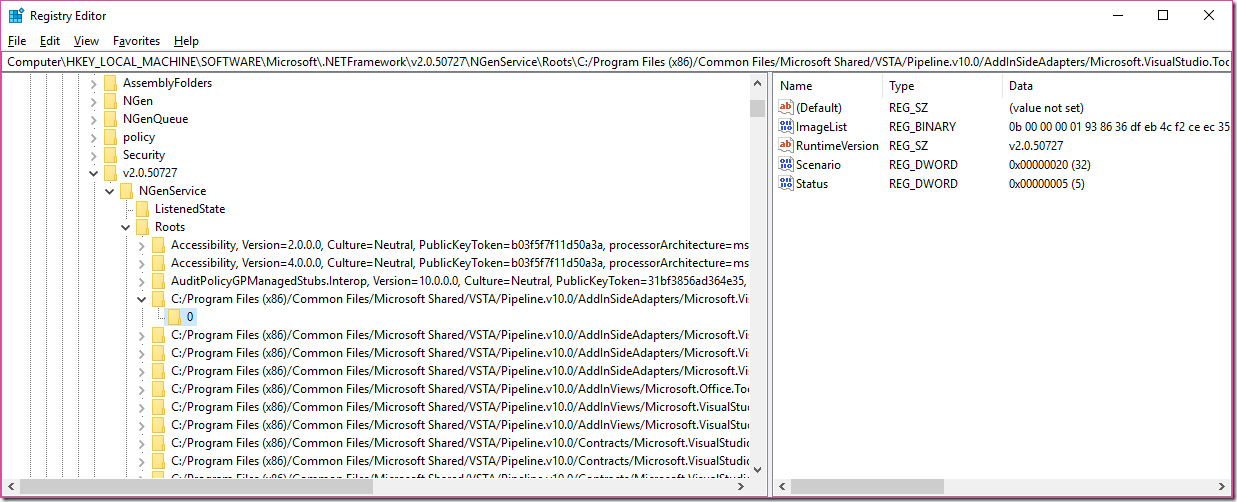
Who said that data collection is difficult? When we look at the NGen registry keys which were accessed we find a large list of all NGenned dlls “cached” in the registry. This is done for performance reasons. The .NET Framework had always a soft spot for the Registry. NGen does it and the GAC also. That is much faster to read than to traverse over 4000 directories only for the 64 bit NGenned dlls.
Since the corruption is data dependent we can simply export the whole NGenService tree into a text file which can hopefully help to diagnose the data corruption.
The resulting text file was over 200 MB in size. It is unlikely that you will find the root cause by looking at a 200 MB text file line by line. We need more clues where we need to look at.
Can We Already Solve?
Pattern identification is a very important skill you need to develop if you want to analyze an issue. One if not the most powerful analysis method is differential analysis. Usually you have a good case and a bad case which you can compare and see where the behavior starts to diverge. But it also works in the other way to find common patterns. The presence or the absence of a deviation can both be a useful hint. It is a good idea to capture the data not only once but several times to be able to find stable patterns in the data.
By looking at the procmon registry trace we can first filter only for the querying of registry contents of the Roots node
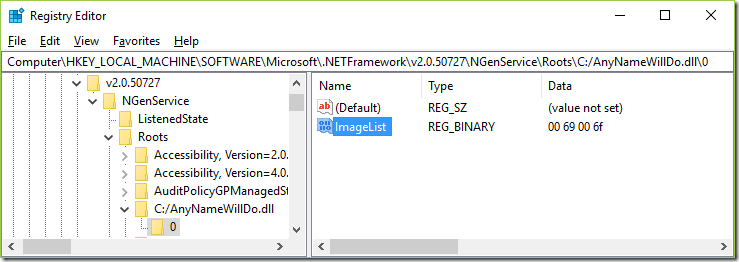
There we find that the last accessed registry key is always the same one. It is a binary registry key named ImageList. But wait. The call stack of that event is not particularly enlightening but it is a strong hint that either that was the last registry key it did read and then one of the previously read registry keys did contain invalid data or that this registry key is the one which is corrupted. Lets check the contents of the ImageList value:
Hm. Not sure if that is the problem. Lets get more data.
Capture Memory Dumps
There are many ways to capture memory dumps but the most flexible tool besides DebugDiag is procdump. It is a simple command line tool which can trigger the creation of a memory dump in very sophisticated ways. In our case it is straightforward. We want to start NGen and then take 3 dumps with 1s in between because the memory leaks is growing very fast.
C:\Windows\assembly\NativeImages_v4.0.30319_64\System\0c9bec7e4e969db233900a4588c91656>procdump -s 1 -n 3 -ma -x c:\temp ngen.exe createpdb system.ni.dll c:\temp
ProcDump v9.0 – Sysinternals process dump utility
Copyright (C) 2009-2017 Mark Russinovich and Andrew Richards
Sysinternals – http://www.sysinternals.com
Process: ngen.exe (14168)
CPU threshold: n/a
Performance counter: n/a
Commit threshold: n/a
Threshold seconds: 1
Hung window check: Disabled
Log debug strings: Disabled
Exception monitor: Disabled
Exception filter: [Includes]
*
[Excludes]
Terminate monitor: Disabled
Cloning type: Disabled
Concurrent limit: n/a
Avoid outage: n/a
Number of dumps: 3
Dump folder: c:\temp\
Dump filename/mask: PROCESSNAME_YYMMDD_HHMMSS
Queue to WER: Disabled
Kill after dump: Disabled
Press Ctrl-C to end monitoring without terminating the process.
Microsoft (R) CLR Native Image Generator – Version 4.7.2556.0
Copyright (c) Microsoft Corporation. All rights reserved.
[23:16:42] Timed:
[23:16:42] Dump 1 initiated: c:\temp\ngen.exe_171212_231642.dmp
[23:16:42] Dump 1 writing: Estimated dump file size is 1418 MB.
[23:16:44] Dump 1 complete: 1419 MB written in 2.4 seconds
[23:16:46] Timed:
[23:16:46] Dump 2 initiated: c:\temp\ngen.exe_171212_231646.dmp
[23:16:47] Dump 2 writing: Estimated dump file size is 4144 MB.
[23:17:42] Dump 2 complete: 4145 MB written in 55.8 seconds
[23:17:44] Timed:
[23:17:44] Dump 3 initiated: c:\temp\ngen.exe_171212_231744.dmp
The command line parts are -s 1 to wait one second between each dump, -n 3 to take three dumps before it exits, -ma to take a full memory dump, -x expects as first argument the dump folder and all other arguments are the executable and its command line arguments. If you look at the command line parameters you will find a lot more. The output a little frightening at first but there is a secret switch (procdump -? -e) which will print a lot of useful examples how procdump is meant to be used. Actually this switch is not secret but nearly no one will read the large command line help until the end which is the reason I spell it out explicitly.
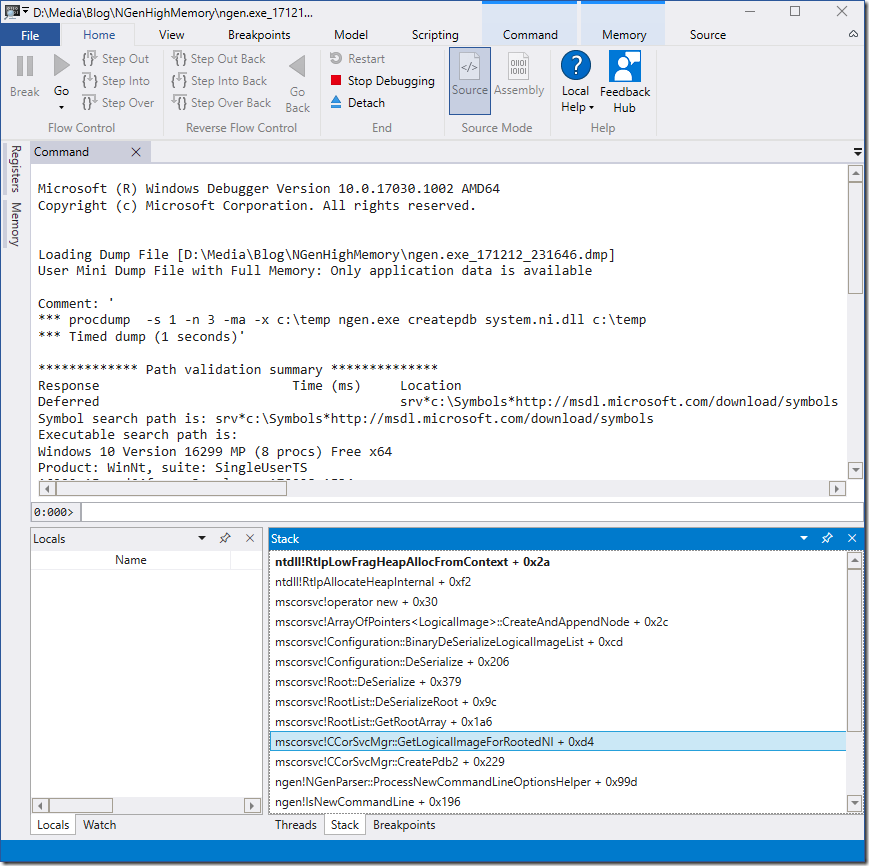
We can load the dump file into the new Windbg which will us give automatically a nice call stack window where NGen was just allocating memory:
That information should be sufficient for any support guy to drill down to the root cause. To make sense of the call stack you need local variables which are not part of the public symbols of MS. For us outsiders that is as far as we can analyze the problem. Really? Lets have a look at the method names. NGen deserializes a Root Array of native image roots from the registry. While it is deserializing a specific root object it deserializes something with a method BinaryDeSerializeLogicalImageList. That sounds familiar to the binary registry node ImageList from our registry dump. When we only could know the registry key it was just deserializing. This involves a little bit poking the in the dark. I would expect that the stack between DeSerialize and BinaryDeSerializeLogicalImageList contains hopefully somewhere the registry key name.
With the k command we get the call stack and the current stack pointers
0:000> k
 # Child-SP          RetAddr           Call Site
00 000000c9`5f2fdcc0 00007ffe`327a8912 ntdll!RtlpLowFragHeapAllocFromContext+0x2a
01 000000c9`5f2fdda0 00007ffe`05eebde6 ntdll!RtlpAllocateHeapInternal+0xf2
02 000000c9`5f2fde60 00007ffe`05eec700 mscorsvc!operator new+0x30
03 000000c9`5f2fde90 00007ffe`05eed445 mscorsvc!ArrayOfPointers::CreateAndAppendNode+0x2c
04 000000c9`5f2fded0 00007ffe`05eed7f1 mscorsvc!Configuration::BinaryDeSerializeLogicalImageList+0xcd
05 000000c9`5f2fe060 00007ffe`05eeffb0 mscorsvc!Configuration::DeSerialize+0x206
06 000000c9`5f2fe300 00007ffe`05ee81b2 mscorsvc!Root::DeSerialize+0x379
07 000000c9`5f2fe630 00007ffe`05eecd98 mscorsvc!RootList::DeSerializeRoot+0x9c
08 000000c9`5f2fe690 00007ffe`05f0b69c mscorsvc!RootList::GetRootArray+0x1a6
09 000000c9`5f2fe960 00007ffe`05f0bb79 mscorsvc!CCorSvcMgr::GetLogicalImageForRootedNI+0xd4
0a 000000c9`5f2fec60 00007ff6`aef17dd7 mscorsvc!CCorSvcMgr::CreatePdb2+0x229
0b 000000c9`5f2ff1c0 00007ff6`aef11f32 ngen!NGenParser::ProcessNewCommandLineOptionsHelper+0x99d
0c 000000c9`5f2ff5d0 00007ff6`aef11d54 ngen!IsNewCommandLine+0x196
0d 000000c9`5f2ff730 00007ff6`aef1276a ngen!trymain+0x19c
0e 000000c9`5f2ffd90 00007ff6`aef126f8 ngen!wmain+0x4e
0f 000000c9`5f2ffe20 00007ffe`30221fe4 ngen!BaseHolder,&Delete,2>,0,&CompareDefault,2>::~BaseHolder,&Delete,2>,0,&CompareDefault,2>+0x2a6
10 000000c9`5f2ffe50 00007ffe`327eef91 kernel32!BaseThreadInitThunk+0x14
11 000000c9`5f2ffe80 00000000`00000000 ntdll!RtlUserThreadStart+0x21
The brute force method is to dump the stack from start to end with
0:000> db c9`5f2fde90 c9`5f2ff1c0
…
000000c9`5f2fe710  18 e7 2f 5f c9 00 00 00-43 00 3a 00 2f 00 41 00  ../_....C.:./.A.
000000c9`5f2fe720  6e 00 79 00 4e 00 61 00-6d 00 65 00 57 00 69 00  n.y.N.a.m.e.W.i.
000000c9`5f2fe730  6c 00 6c 00 44 00 6f 00-2e 00 64 00 6c 00 6c 00  l.l.D.o...d.l.l.
000000c9`5f2fe740  00 00 74 00 75 00 62 00-73 00 2e 00 49 00 6e 00  ..t.u.b.s...I.n.
000000c9`5f2fe750  74 00 65 00 72 00 6f 00-70 00 2c 00 20 00 56 00  t.e.r.o.p.,. .V.
000000c9`5f2fe760  65 00 72 00 73 00 69 00-6f 00 6e 00 3d 00 31 00  e.r.s.i.o.n.=.1.
000000c9`5f2fe770  30 00 2e 00 30 00 2e 00-30 00 2e 00 30 00 2c 00  0...0...0...0.,.
000000c9`5f2fe780  20 00 43 00 75 00 6c 00-74 00 75 00 72 00 65 00   .C.u.l.t.u.r.e.
000000c9`5f2fe790  3d 00 4e 00 65 00 75 00-74 00 72 00 61 00 6c 00  =.N.e.u.t.r.a.l.
000000c9`5f2fe7a0  2c 00 20 00 50 00 75 00-62 00 6c 00 69 00 63 00  ,. .P.u.b.l.i.c.
000000c9`5f2fe7b0  4b 00 65 00 79 00 54 00-6f 00 6b 00 65 00 6e 00  K.e.y.T.o.k.e.n.
000000c9`5f2fe7c0  3d 00 33 00 31 00 62 00-66 00 33 00 38 00 35 00  =.3.1.b.f.3.8.5.
000000c9`5f2fe7d0  36 00 61 00 64 00 33 00-36 00 34 00 65 00 33 00  6.a.d.3.6.4.e.3.
000000c9`5f2fe7e0  35 00 2c 00 20 00 70 00-72 00 6f 00 63 00 65 00  5.,. .p.r.o.c.e.
000000c9`5f2fe7f0  73 00 73 00 6f 00 72 00-41 00 72 00 63 00 68 00  s.s.o.r.A.r.c.h.
000000c9`5f2fe800  69 00 74 00 65 00 63 00-74 00 75 00 72 00 65 00  i.t.e.c.t.u.r.e.
000000c9`5f2fe810  3d 00 61 00 6d 00 64 00-36 00 34 00 00 00 00 00  =.a.m.d.6.4.....
…
where we find the registry key which is currently being worked on:
0:000> du 000000c9`5f2fe718
000000c9`5f2fe718  "C:/AnyNameWillDo.dll"
It looks like the ImageList of this dll is corrupted which did cause NGen to go into an infinite loop. A deeper look at the surrounding registry keys from the registry export revealed that another registry key of the previous dll was also corrupted. This is really strange and I have no idea how NGen could manage to corrupt two unrelated registry keys RuntimeVersion (string) and ImageList (binary).
Capture ETW Traces
Based on our previous investigations we should get data about memory allocation, CPU consumption and accessed registry keys which should give us a good understanding how the problem evolves over time. To capture ETW data you need normally to download and install the Windows Performance Toolkit which is part of the Windows SDK. But since Windows 10 the command line only tool named wpr.exe is part of Windows itself. That can be important if you are working on a machine which is locked down with e.g. Device Guard and you cannot install new software easily and you cannot execute not Authenticode signed binaries which rules many home grown data collection tools out. Normally I use ETWController (http://etwcontroler.codeplex.com/) which enables me to capture mouse and keyboard interactions along with screenshots which has proven to be invaluable many times. But on a locked down machine one needs to use the tools which you can start.
C:\WINDOWS\system32>wpr -start CPU -start Registry -start VirtualAllocation -start GeneralProfile

… Ngen ….

C:\WINDOWS\system32>wpr -stop c:\temp\NgenGoneCrazy.etl
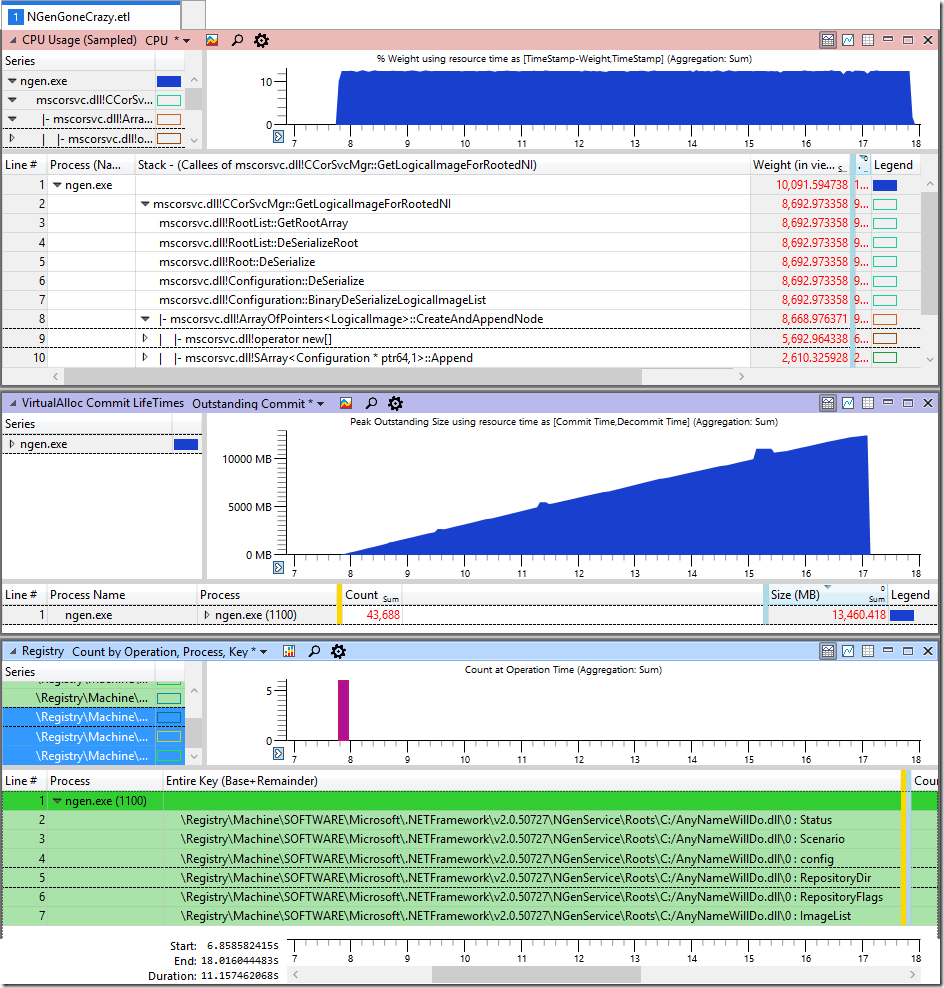
After loading the ETL file into WPA and a little working out the important metrics like CPU, Allocation and Registry accesses we get this one:
We find that practically all CPU is spent in allocating memory while the method BinaryDeSerializeLogicalImageList was executed. The VirtualAlloc graph shows a frightening allocation rate of 1,4 GB/s which is the most massive memory leak I have seen since a long time. The last graph shows that the huge allocation rate starts once the ImageList of the dll C:/AnyNameWillDo.dll was read. After that no more registry keys were read which is strong indicator that this registry key is the one knocking NGen out.
After realizing that it was easy to come up with a minimal registry file which will bring NGen down
NgenCorrupt.reg
Windows Registry Editor Version 5.00

[HKEY_LOCAL_MACHINE\SOFTWARE\Microsoft\.NETFramework\v2.0.50727\NGenService\Roots\C:/AnyNameWillDo.dll]
[HKEY_LOCAL_MACHINE\SOFTWARE\Microsoft\.NETFramework\v2.0.50727\NGenService\Roots\C:/AnyNameWillDo.dll\0]
"ImageList"=hex:00,69,00,6f
When you import that reg file and you execute
ngen.exe createpdb system.ni.dll c:\temp
in the directory where the native image of System.ni.dll is located NGen will explode. But beware that at least on Windows 10 my machine did freeze and never recover when all physical memory was allocated. It seems that older Windows editions (e.g. Server 2008 R2) deal with such rapidly allocating applications in a better way which lets you at least terminate the application once it has gotten all physical memory.
Conclusions
After have drilled down that far it is pretty clear where NGen did break although it remains a mystery how the registry keys were corrupted. The case is currently being investigated at Microsoft which will hopefully result in a more robust NGen which will ignore bogus registry entries and delete them which should cause the recreation of the missing NGen root entries some time later. The data sent to MS are memory dumps, and ETL Trace, procmon trace and the reg file to corrupt the registry on a test machine.
Troubleshooting is not magic although many people assume magic happening here. It is pretty straightforward to capture the relevant data with some experience. Analyzing the captured data is indeed a complex undertaking and requires a lot of experience. The goal of this blog post is to help other people dealing with failures to understand what data is needed and why. Capturing the data is much easier and faster than to analyze it. If you capture the right data you will make the work of others trying to help you a lot easier.
I always tell people that it makes no sense to assign one guy of a team as troubleshooter and send him to a Windbg/ETW training. First of all if someone is assigned to a task he dislikes he will never be good at it. Second it needs a lot of practice and experience to be able to drill down this deep. If you are trying to analyze such an issue once every few months you will not have the necessary skills to use the tools correctly. If you want to bring a member of your team at a good level to troubleshoot hard issues he/she must be willing to look at a memory dump nearly every day. If no one raises his hand for this task you can spare the money for the Windbg/ETW training. But it makes sense to bring all team members to a level where everyone understands what data is needed to let some specialized guys to look into the issues in an efficient manner by providing enough and the right data to successfully nail the root cause. As a positive side effect more people will get used to these tools and some guys will like to drill deeper. These are the ones you should send to a Windbg/ETW training.
That’s all for today. Remember: Great tools are useless. Tools become great when people use them.




Great article. I learned a lot about the use of WinDbg and ETW as well as now having some idea why NGen used to go crazy on a Win7 dev machine I used a few years ago. 🙂
LikeLike
Thanks for sharing this Alois! I really liked how you argued that “…it makes no sense to assign one guy of a team as troubleshooter…”. I see it exactly the same way and this whole thing could be generalized. One will really struggle building up some expertise without actually caring.
LikeLike
Very good post. This is the high level troubleshooting techniques.
LikeLike